Hauptinhalt
Topinformationen
Video Visual Analytics
There has been a lot of effort to provide computer vision techniques to extract meaningful information from video, nevertheless, automated computer vision is not yet powerful enough for reliably detecting, e.g., anomalies, tracking objects, or higher reasoning. To bridge this gap, automatic approaches can be combined with video visualization in visual analytics (VA) systems, where humans are still required in the loop of analysis to assess the situation or problem, set up hypotheses from evidences and make a decision; to support the analyst in observing events, and in the formulation and evaluation of hypotheses.
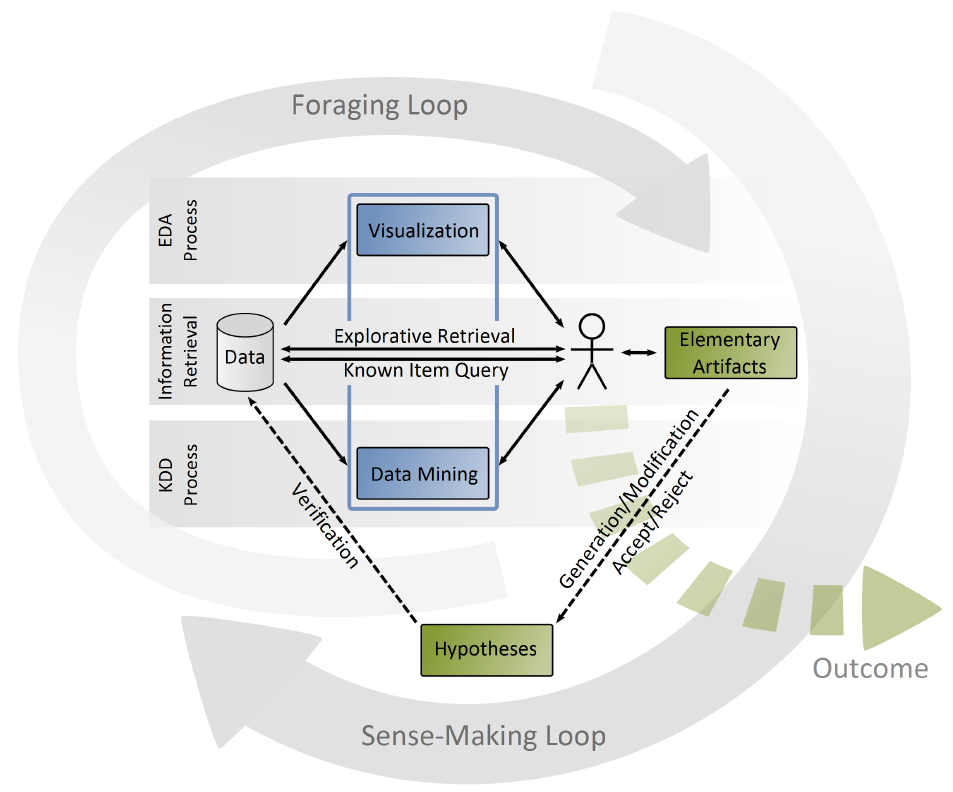
 Figure 1. The visual analytics process model [B.Höferlin, 1/2013].
The general visual analytics model proposed by B.Höferlin is illustrated in Figure 1. The core of this model represents the sense-making loop which hypotheses are derived from elementary reasoning such as evidences. After hypothesis generation, each cognitive theory has to be checked which leads to some insights to the data. In contrast to the sense-making loop that mainly involves higher levels of abstraction, the foraging loop is to derive elementary reasoning artifacts from data which can be described as extracting relevant information from and discovering knowledge in, data. The visual analytics' foraging loop is the combination of automatic and interactive data analysis which is reflected in the close integration of three main knowledge extraction methodologies: exploratory data analysis (EDA), knowledge discovery in database (KDD), and information retrieval (IR). EDA is the human-centered process of generating models of data with large support of statistical graphics. The counterpart to EDA, the data-driven KDD process utilizes automatic data mining by applying data that produce particular patterns or models. While EDA and KDD are largely data-riven, IR enables the analysts to pose queries to the database which help analyst develop and check higher knowledge constructs for subsequent sense-making. Although the Figure 1 suggests a clear separation of processes, nevertheless, the visual analytics process transition are diluted and all processes are iterative and recursive.

Figure 2. Major components and information flow involved in the inter-active learning process [B.Höferlin, 2/2012].
A successful example for applying VA for video is an inter-active learning of ad-hoc classifier for video surveillance by B.Höferlin which is demonstrated in the video clip below. The system engages a human analyst in several layers of processing, e.g., training classifiers by using an inter-active learning approach as the information flow shown in Figure 2. The learning process of classifier is used as filters within the analytical reasoning process. Analyst can also directly adjust the complex classifier models. As a consequence, user builds up the trust from the training process generated by these models. The system also provides a detail-on-demand technique for selected parts of data, as well as a filter feedback to verify the hypotheses.

